Your Datadog bill grew.
Here's how to find out why.
For engineers and finance leads at mid-market SaaS companies — the ones spending $15K–40K/year on Datadog with no dedicated FinOps team to watch it. Five patterns account for most avoidable Datadog overspend: sample-rate mismatches, retention filters stuck at 100%, synthetics polling what a health-check metric already covers, untagged custom metrics, unused committed capacity. Every one of them you can check yourself, today, with API calls you already have access to. Below is exactly how — plus an app that runs the same checklist for you if you'd rather not do it by hand.
$ ddcostcontrol scan --org prod
Scanning estimated_cost, sub-org view... done (2.1s)
Breaking down by product_family... done (4.4s)
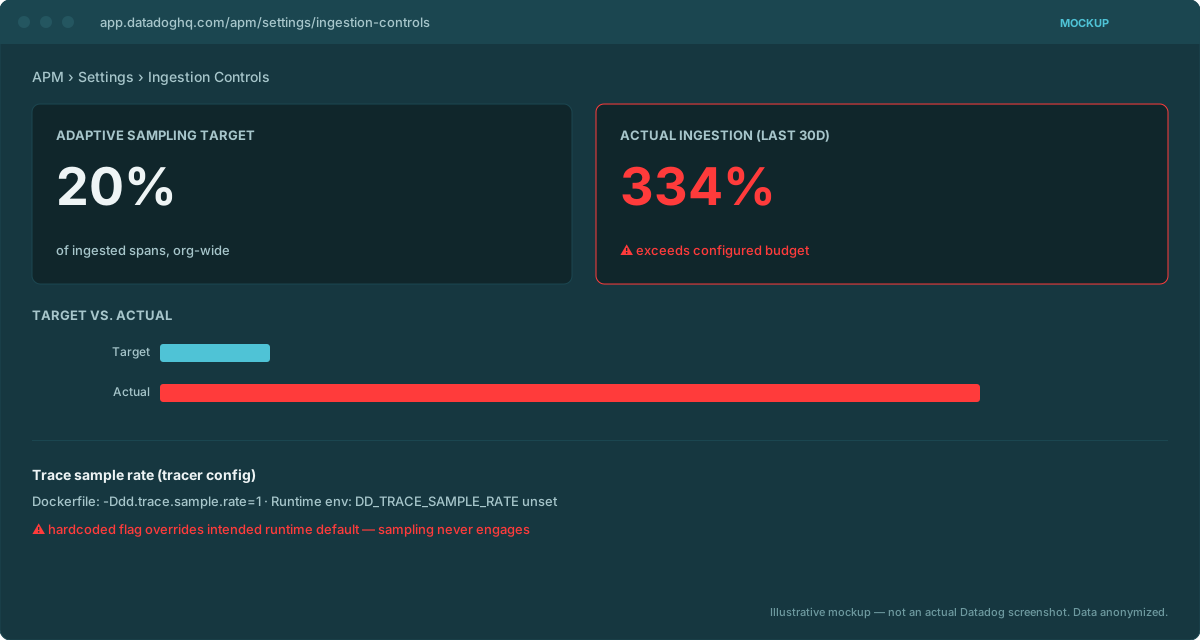
✗ APM ingestion 334% over Adaptive Sampling Target
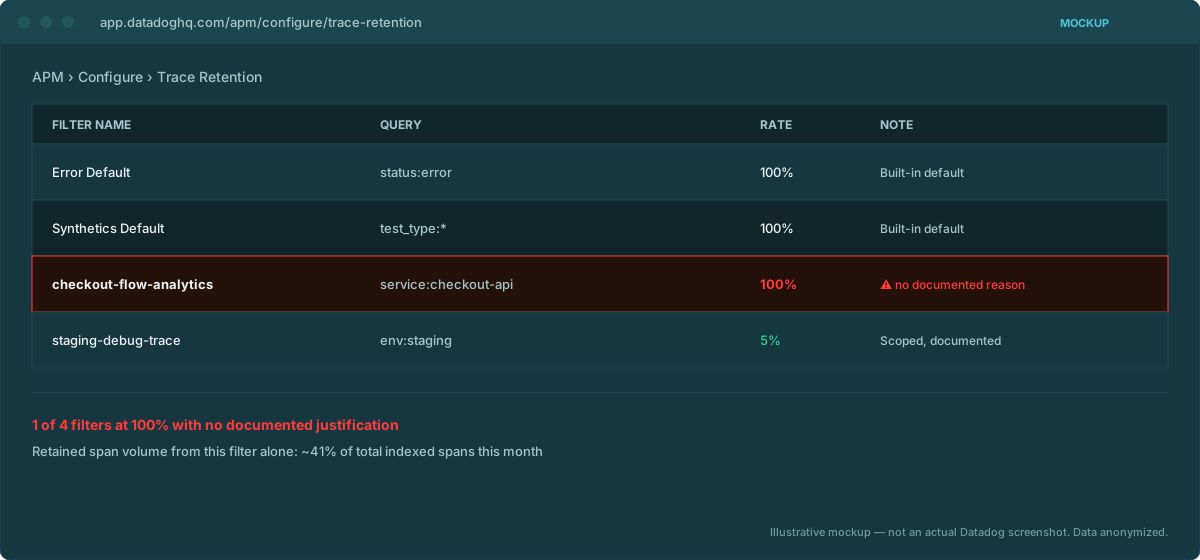
✗ Retention filter "checkout-flow-analytics" at 100%, no reason on file
✓ Custom metrics — tags healthy, cost negligible
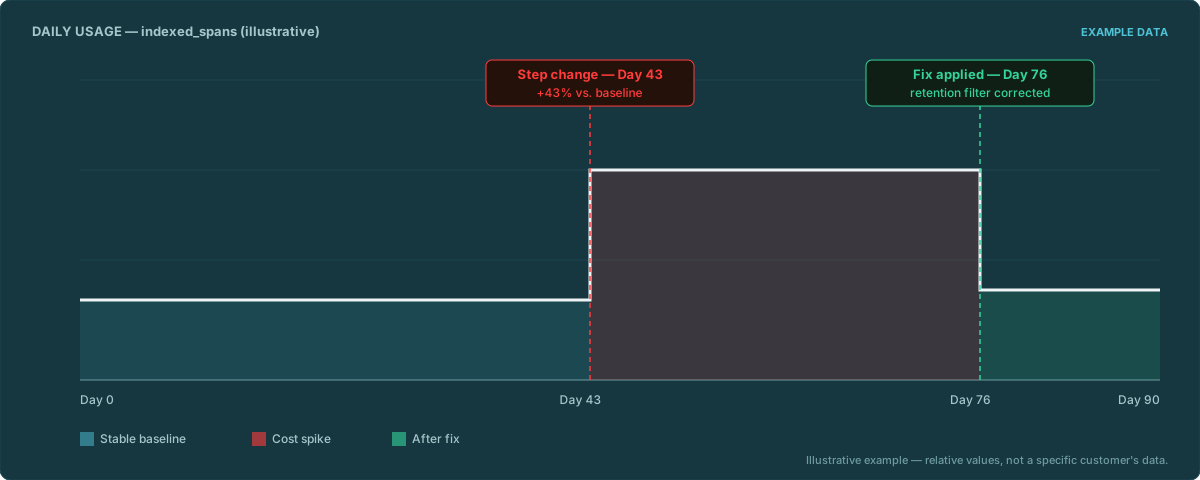
✗ Step-change detected: Day 43, +43% vs. baseline

4 findings written to report.md
Why this keeps happening
Datadog bill shock isn't rare or exotic — it's a predictable side effect of usage-based pricing across many independently-scaling dimensions, landing hardest on the accounts with nobody assigned to watch them.
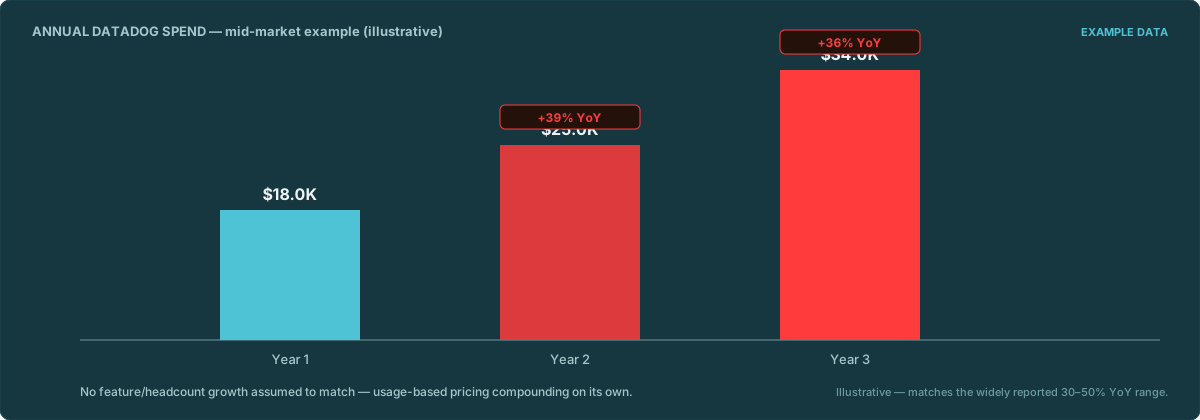
The checklist — what to check, and where
Each item below is a pattern we've personally traced through a real Datadog bill, with the exact API calls and UI screens to check it yourself.
1. APM sample rate vs. Adaptive Sampling Target
Datadog's Adaptive Sampling Target and a manually set trace sample rate can silently disagree — a hardcoded flag in a Dockerfile or build step fighting an environment variable set at runtime, each one thinking it's in control. The result isn't a small overage; ingestion can run at several times a configured budget, entirely on-demand-billed, for months before anyone notices.
Where to check: GET /api/v2/apm/config/retention-filters for the filter side, and Datadog → APM → Settings → Ingestion Controls in the UI for the sampling side. Compare the configured rate against actual span volume from usage/hourly_usage filtered to indexed_spans.
Sometimes this can't be determined automatically at all — no filter matches the naming convention. See when the tool can't tell you the answer.
2. Retention filters left at 100% rate
Every APM setup ships with built-in default filters (things like "Error Default" and "Synthetics Default") already configured — easy to forget they exist. Any filter sitting at a rate of 1 (100%) with no documented reason is indexing everything that matches it, unfiltered, since the day it was created.
Where to check: GET /api/v2/apm/config/retention-filters — read every filter's rate field, not just the ones you remember configuring. In the UI: Datadog → APM → Configure → Trace Retention.
The inverse case shows up too — a 100% filter matching zero spans. See a retention filter at 100% that matches nothing.
3. Synthetics polling what a metric already covers
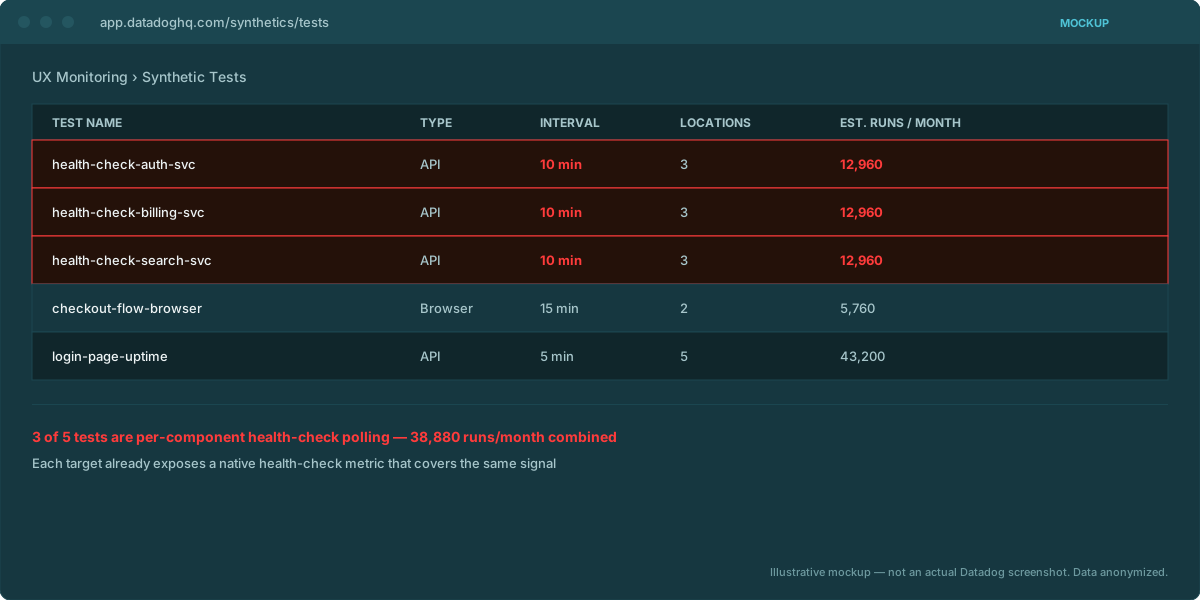
Per-component API tests that hit a health endpoint every few minutes are a common default, and a common candidate for replacement by a native health-check metric that costs a fraction as much. Run-volume math: 2,592,000 / tick_every (seconds) gives runs per month, per location — multiply by locations to see the real monthly count.
Where to check: Datadog → UX Monitoring → Synthetic Tests for the list and each test's interval; GET /api/v1/synthetics/tests for the same data via API, including options.tick_every.
4. Custom metrics without env/service tags
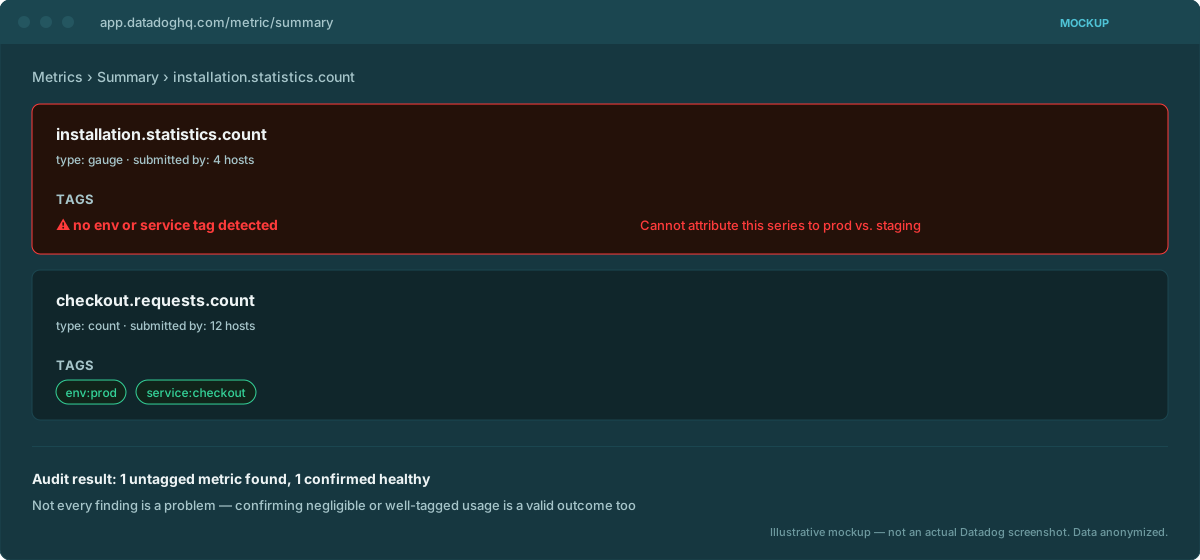
A custom metric shipped without an env or service tag blends production and staging data into one indistinguishable series — you can't attribute cost, and you can't tell if it's even the environment you think it is. Note: sometimes this check turns up nothing, and confirming a metric is genuinely negligible ($0.00 of real cost) is a legitimate, useful finding on its own.
Where to check: usage/hourly_usage filtered to timeseries, cross-referenced against the metric's tag configuration in Metrics → Summary.
5. Committed capacity nobody is using
A committed line item — log indexing capacity is the common case — billed every month whether it's used or not. Zero actual usage against a paid commitment is a pure-waste finding, and one of the easiest to fix outright.
Where to check: compare your contract's committed figures against usage/hourly_usage actuals for the same product family, over a full billing period.
Zero committed coverage across an entire contract is the same finding at larger scale. See what to actually do about 100% on-demand spend — though sometimes the right call is not to commit at all.
Automating this exact checklist against your own org — instead of pulling each API response by hand — is what the app does. See how.
Do it by hand, or automate it
The checklist above works with nothing but `curl` and a Datadog API key. The app exists for when you'd rather not run it by hand every quarter.
Run the checklist yourself
Every check above is a documented API call or a UI screen you already have access to. No install, no license, no cost. Good fit for a one-off investigation or if you just want to understand what's driving a specific line item.
DDCostControl, the app
Runs the full checklist against your own org on a schedule, walks day-by-day usage history to find the exact date a cost stepped up, and drafts either a fix or a support-ticket question for anything it isn't sure about. Same checks, no manual API pulls.
How the app runs it
Detect the spike
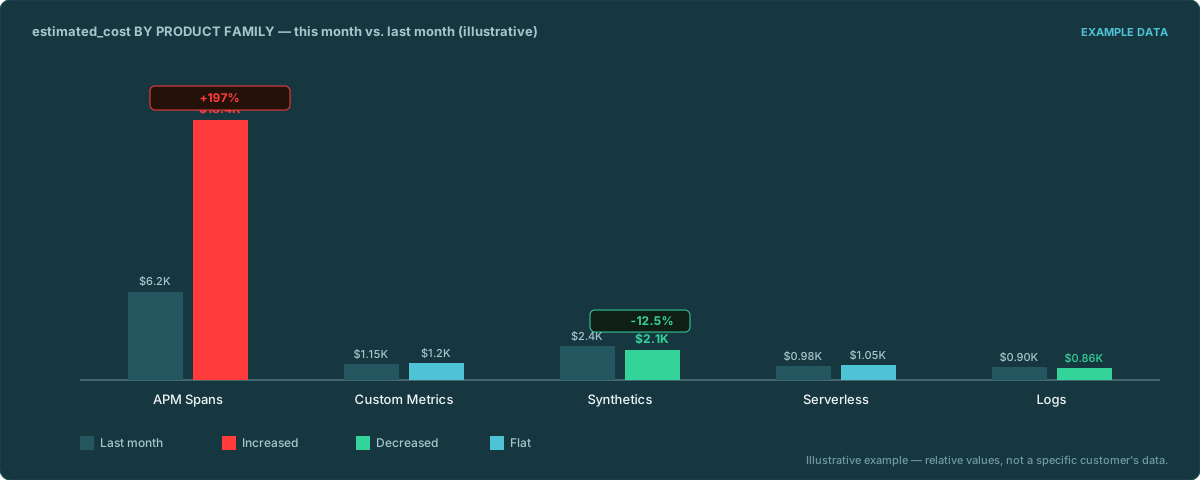
Compares estimated_cost per product family across months to spot step-changes and trends before they become a surprise invoice.
Find the source
Breaks the spike down by product family — APM spans, custom metrics, synthetics, serverless — using usage/hourly_usage.
Find the day
Walks day-by-day usage history to find the exact date usage stepped up — the pattern that turns "it's expensive" into "it started on the 14th."
Propose the fix
Matches findings against the checklist above and drafts either a concrete fix or the support question to ask when it's not sure.
Download
Available for macOS, Windows, and Linux. Free binary, no account, no card.
Free inventory scan on first run — shows which checklist items triggered, no fix details. Full diagnosis + fixes unlock with a license. See pricing.
Runs self-hosted, keys stay on your machine, LLM layer is Zero Data Retention / EU-hosted — full data-handling details.
Talk to us
Managing a Datadog bill that doesn't add up? We'd rather talk to 10 real users before we finish deciding pricing than guess. Email us directly — no form, no funnel.
Email us — arena@wagoe.com