The other 100% retention filter: the one matching nothing
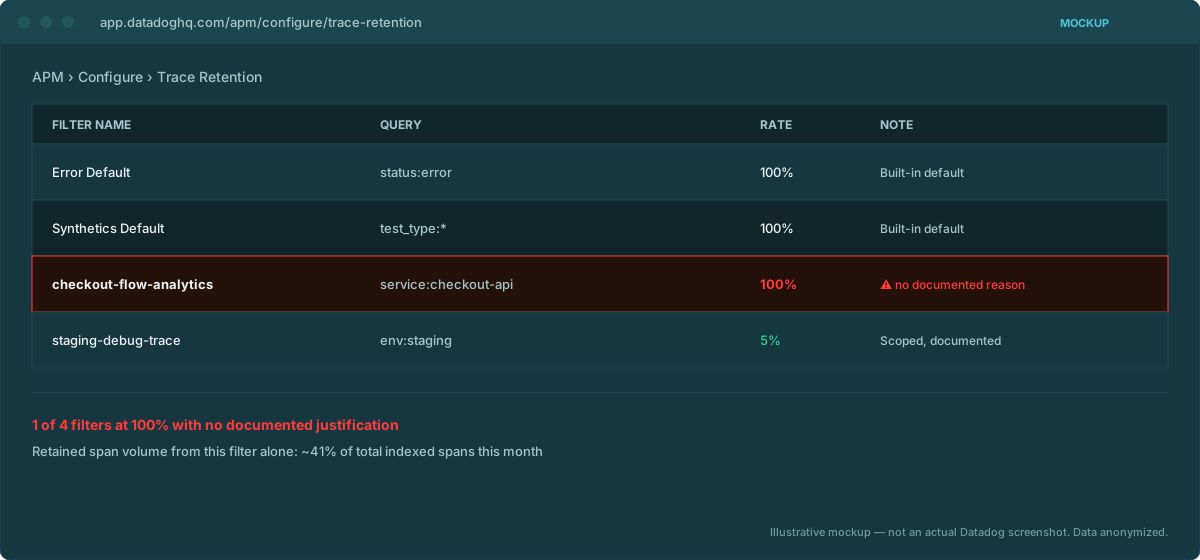
We've written before about retention filters stuck at 100% rate — the failure mode where a filter is expensively over-retaining a real volume of spans with no documented reason. A recent beta run against a workforce-scheduling SaaS company's org turned up the mirror image of that finding: a filter named default, configured at rate 1.00 (100%), that matched exactly zero spans in the last 24 hours. (A later run against the same anonymized company turned up the identical pattern again, this time under a filter named Keep errors — worth treating as a recurring check, not a one-off curiosity.)
Same rate. Opposite problem. Worth separating clearly, because the right response to each is different.
Why "matches nothing" is actually the easy case
A live 100%-rate filter that's genuinely indexing a lot of volume forces a judgment call: how far do you dial it back, and does anyone need the full retention for compliance or active debugging reasons? That's a conversation, not a one-line fix — you're weighing a real tradeoff between cost and visibility.
A filter matching zero spans has no tradeoff to weigh. There is no volume being protected by keeping it at 100%, because there is no volume matching it at all. The tool's own advice on this finding was direct: "this filter isn't currently retaining anything; at rate 1.00 this looks like a safe candidate to disable or remove rather than reduce." Reducing the rate on a filter that matches nothing accomplishes nothing — there's nothing to reduce. The only sensible action is removing it outright, and there's no cost-vs-visibility decision attached to that action, because visibility was already zero.
So why flag it at all, if it costs nothing?
Because a retention filter matching zero spans didn't necessarily start that way, and the fact that it's at zero now is itself information. A filter named default at 100% almost certainly wasn't created to match nothing on purpose — filters get written against a query intended to catch something. Zero matches over a full day means one of a small number of things happened:
- The service or environment the filter's query was scoped to was decommissioned, and nobody removed the now-orphaned filter along with it.
- A refactor changed tag names, service names, or span attributes, and the filter's query silently stopped matching anything — with no error, no alert, just quiet irrelevance.
- The filter was created for a temporary purpose (an investigation, a migration window) and simply outlived its reason for existing.
None of these are expensive today. All of them are a small piece of config debt — a rule sitting in your Datadog org that nobody currently understands the purpose of, discoverable only by someone deliberately auditing the full filter list rather than tripping over it by accident. Cleaning it up costs nothing and removes one more thing a future audit has to spend time re-investigating from scratch.
The general pattern: not every finding is a cost problem
This is worth stating plainly because it's easy to assume a cost-diagnostic tool only has value when it finds something expensive. Confirming that a filter, or a metric, or a synthetic test is genuinely inert — costing nothing, matching nothing, safe to remove with zero tradeoff — is a legitimate and useful finding on its own, the same way a custom-metrics audit sometimes correctly concludes a metric is negligible rather than manufacturing a problem to report. A dead filter isn't costing this org money. It's still worth knowing about, and it's still worth deleting.
DDCostControl reads every retention filter's actual matched volume, not just its configured rate — flagging both the ones over-retaining real traffic and the ones quietly matching nothing at all.
Email us — arena@wagoe.com