Synthetics, custom metrics, and the committed capacity nobody uses
Not every Datadog cost problem is a dramatic spike. Some of it is three small, boring line items that individually look fine and collectively add up to real money, none of which will ever trigger an alert because none of them are wrong, exactly — they're just no longer necessary. Here's how to check for each.
1. Synthetic tests that duplicate a health check
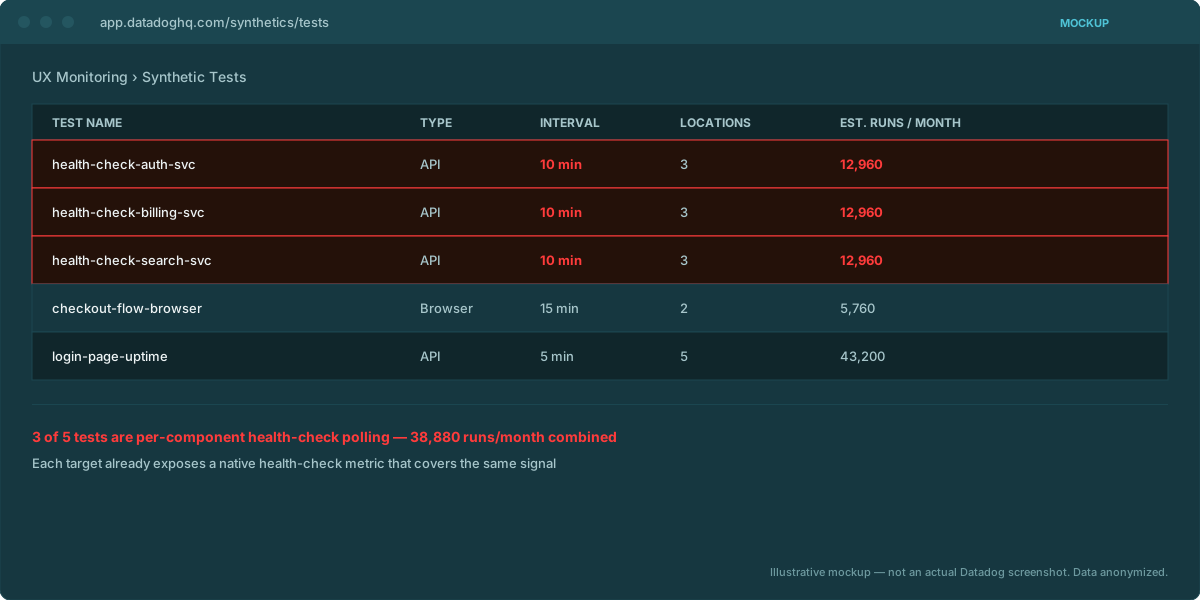
Datadog Synthetics is genuinely useful for testing things you can't observe from inside your own infrastructure — full user journeys, third-party dependencies, DNS and TLS from multiple regions. It's a much worse fit for polling an internal service's /health endpoint every few minutes from a synthetic location, when that same service is already emitting a native health-check metric your APM or infrastructure monitoring already ingests for free. In one real audit, this exact pattern accounted for the large majority of an org's total synthetic API test count — dozens of tests, each independently polling a component health endpoint on a tight interval, all replaceable by metrics the service was already producing.
The cost math is straightforward once you have the config: options.tick_every (in seconds) times the number of locations gives you runs per month per location, using 2,592,000 / tick_every (seconds in a 30-day month) as the runs-per-location figure. A test running every 10 minutes (600 seconds) from one location is 2,592,000 / 600 = 4,320 runs a month, on its own. Multiply that across a couple dozen similar tests and multiple locations, and it's a meaningful, entirely avoidable chunk of the synthetics line.
Check it via GET /api/v1/synthetics/tests: pull every API test, apply the formula, and look specifically for tests hitting internal endpoints on short intervals — those are the deletion candidates.
2. Custom metrics without an env or service tag
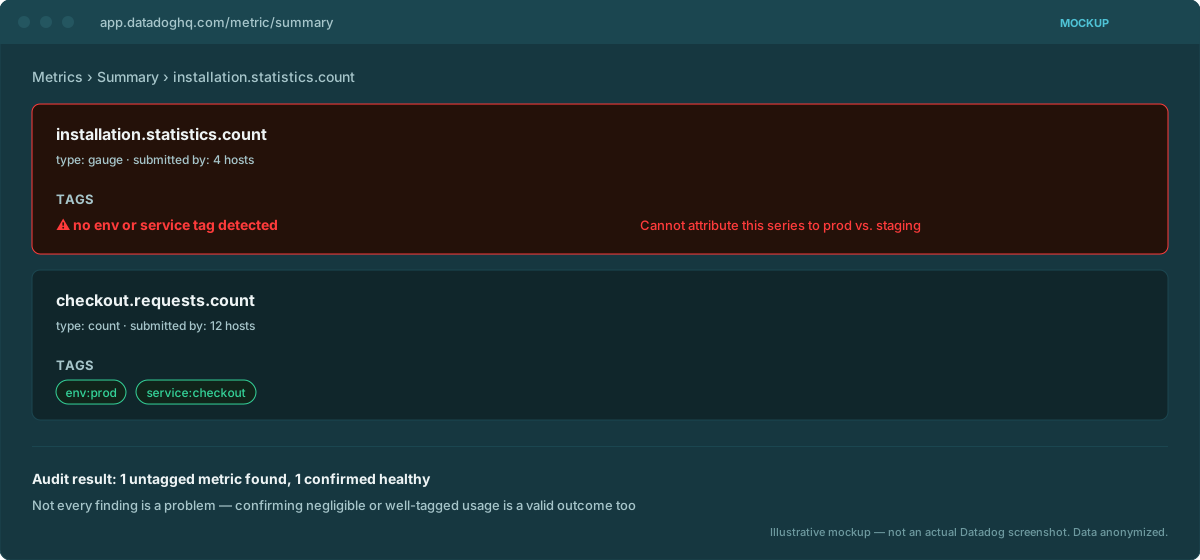
Custom metrics are billed largely on cardinality and volume, and Datadog's own guidance is consistent about tagging discipline for a reason: a metric shipped without an env or service tag doesn't just cost money, it makes the cost unattributable. Production and staging traffic for the same metric name blend into one series with no way to separate them after the fact. In a real case we looked at, a set of gauges tracking installation-level statistics had no tags at all — meaning production and acceptance environments were reporting into the same undifferentiated series, and nobody could say with confidence which environment was driving the volume.
Worth saying explicitly: sometimes this audit finds nothing wrong. Confirming that a given custom metric's actual usage is negligible — genuinely near-zero cost — is a legitimate and useful finding on its own. Not every check has to surface a problem to be worth running; ruling something out is real information too.
Check it via GET /api/v2/usage/hourly_usage filtered to the custom metrics (timeseries) product family, cross-referenced against your metric tag configuration — any high-volume metric missing standard tags is the flag.
3. Committed log capacity running at ~0% usage
Committed-use contract line items are cheaper per unit than on-demand, which is exactly why they get purchased ahead of actual need — and exactly why they're easy to forget once actual usage doesn't grow into them. A committed logs_indexed_7day capacity that's been paid for every month while actual indexed log volume sits near zero is pure sunk cost with no offsetting benefit; you're paying for headroom nobody is using.
Check it by comparing your contracted committed capacity against actual usage from usage/hourly_usage for the logs product family over a full billing period. If utilization is persistently near zero, that's a straightforward conversation to have at the next contract renewal, not a technical fix.
Why these three together
None of these require deep Datadog expertise to fix once found — they're mostly deletion, tagging discipline, and a renewal conversation. The actual work is in finding them, because each one lives in a different API, none of them show up on a dashboard by default, and none of them are wrong enough to alert on. That's the gap a fixed, repeatable checklist closes.
DDCostControl checks all three of these automatically against your own usage and synthetics APIs — including confirming when a metric's cost is genuinely negligible, not just when it finds a problem.
Email us — arena@wagoe.com