Retention filters stuck at 100%: how to check in five minutes
Datadog separates two decisions that are easy to conflate: how many spans get ingested, and how many of those ingested spans get indexed — kept, searchable, and billed for retention. The second decision is made by retention filters: rules that say "keep this percentage of spans matching this query." A filter with a rate of 1 keeps 100% of whatever it matches. That's sometimes exactly right. It's also the setting nobody remembers turning on, because in a lot of cases nobody turned it on at all — it shipped that way.
The filters you didn't configure
Datadog ships with built-in default filters — things like an "Error Default" filter and a "Synthetics Default" filter — pre-configured out of the box, typically at a high retention rate, because keeping all your errors and all your synthetic check traces is a reasonable default. The problem isn't that these exist. The problem is that they're easy to forget exist, and easy to lose track of as your span volume grows around them. A filter that made sense when you had a handful of services and a few thousand spans a day can be indexing a genuinely large and expensive volume once you've scaled — with nobody having made an active decision about it at the current scale.
The same applies to any custom filter your team added early on with a rate of 100% "just to be safe" during initial rollout, and never revisited.
The check
One call: GET /api/v2/apm/config/retention-filters. It returns every retention filter currently configured for the org — built-in and custom — along with each one's query, rate, and enabled/disabled state. Read down the list and ask, for every filter at rate 1:
- Is there a documented reason this needs 100% retention — compliance, a currently-active incident investigation, a genuinely low-volume error path?
- Or did someone set it once, early, and nobody has looked at it since?
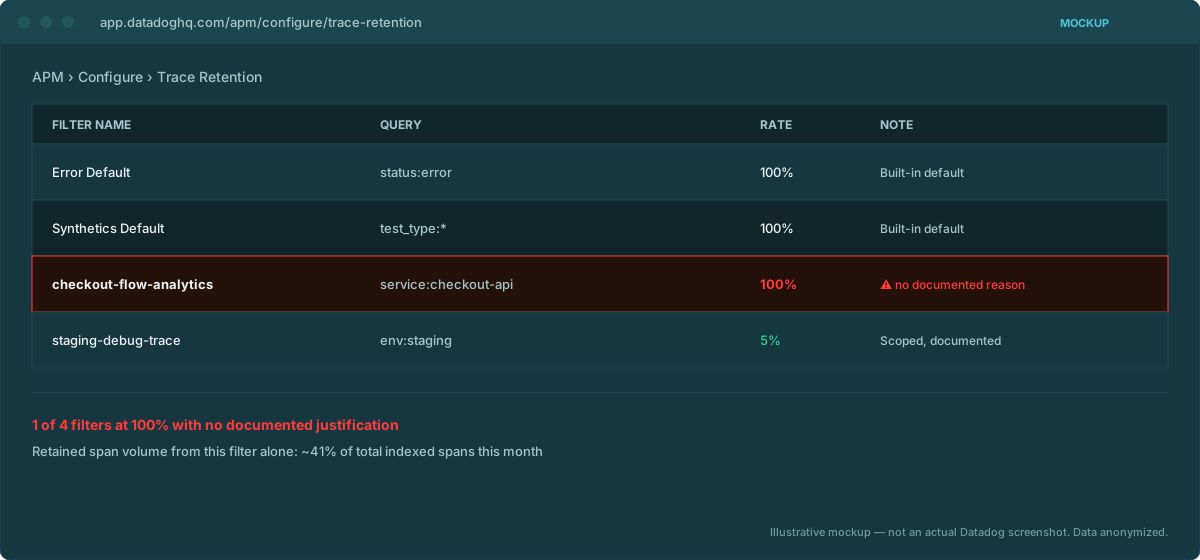
That second category is the finding. It's not a bug, exactly — nothing is broken — but it's spend with no owner and no active justification, which is precisely the kind of thing that survives for years in a mid-market org with no dedicated FinOps function.
What a reasonable audit looks like
In practice this is a short exercise, not a research project:
- Pull the full filter list and rank by estimated span volume matched (cross-reference against
usage/hourly_usagefor the spans product family if you want actual numbers rather than just the query). - For each filter at 100%, get a one-line answer from whoever owns that service: intentional, or leftover?
- For "leftover" filters, drop the rate to something deliberate — often single-digit percent for routine traffic, kept high only for error paths and anything actively under investigation.
This is also a good moment to check it against sample rate configuration, since the two compound each other — covered in the sample rate post. A sampling mismatch that over-ingests and a retention filter that indexes all of it is the two-cause version of the same invoice line growing for no reason anyone can currently explain.
DDCostControl pulls every retention filter automatically, flags any at 100% with no documented exception, and estimates the actual span volume each one is indexing — one section of its v1 detection checklist, run against your own org.
Email us — arena@wagoe.com