Why so many Datadog bills are exploding in 2026
If you've searched for your own Datadog invoice number recently, you've probably also found someone else's. There's a recognizable genre of post at this point: a Hacker News thread about a bill that hit somewhere around $83K a year and ended in a cancellation, Datadog's own famously viral internal incident where usage tracking put a number near $65M in front of people who did not expect it, and a growing stack of 2026 blog posts from observability and cost-management vendors all writing some version of "Datadog bill shock." None of this is a coincidence, and none of it is really about Datadog being a bad product. It's about who is paying the bill and who is watching it.
The segment nobody is optimizing for
Datadog reports roughly 32,700 customers. Of those, an estimated ~4,550 sit above $100K in annual recurring revenue — enterprise accounts large enough to get a dedicated Customer Success Manager and, more importantly, large enough to justify their own internal FinOps function. Someone on the customer's side is job-titled to watch that spend.
That leaves roughly 28,000 customers in the mid-market band. These are teams paying somewhere in the $15K–$40K per year range — real budget, but not enough to justify a dedicated cost owner, and usually not enough to get much proactive attention from the vendor side either. Nobody is deliberately ignoring this segment; it's just below the threshold where either side invests in active cost management. The result is a large population of customers whose bill is being watched by nobody in particular.
Usage-based pricing across too many independent dials
The deeper reason this segment specifically gets hit is structural. Datadog bills across many product families — APM spans, custom metrics, synthetics, log indexing, serverless, infrastructure hosts — and each one scales independently based on what your code and infrastructure happen to be doing that month. A single deploy can simultaneously change your span volume, your custom metric cardinality, and your synthetic test count, and none of those changes trip any alert, because none of them are errors. They're just... more usage.
Compare that to the kind of monitoring most teams already have: alerting is tuned for uptime, latency, and error rate — the things that page someone at 3am. Cost is not one of those things by default. A tracer sample rate that quietly disagrees with an Adaptive Sampling Target, or a retention filter left at its default rate, doesn't throw an error. It throws a number, once a month, on an invoice that a lot of engineers don't read line-by-line.
30–50% year-over-year, reportedly, and rising
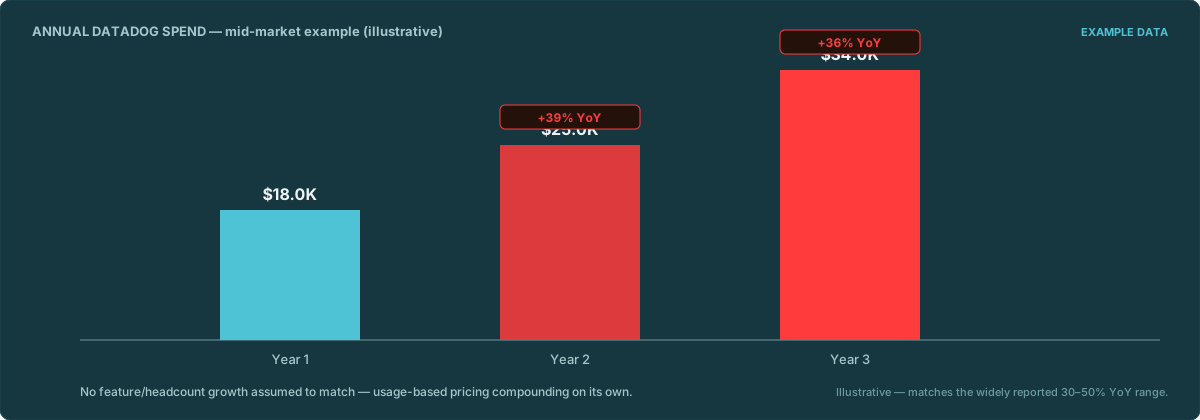
Multiple sources in this space report Datadog bills growing 30–50% year over year at a large share of customers — often outpacing actual usage or team growth. That gap between "our traffic grew 15%" and "our bill grew 45%" is exactly the kind of thing that should trigger an investigation, but in a 28,000-customer segment with no dedicated cost owner, it usually doesn't get one until finance asks a question nobody has a good answer to.
What actually closes the gap
The fix isn't a dashboard you have to remember to check. It's a small, fixed checklist of known failure patterns — sample rate mismatches, retention filters stuck at 100%, untagged custom metrics, synthetics that duplicate a health check, committed capacity nobody is using — run against your own usage API on a schedule, with the output framed as "here's what changed and when," not just "here's a chart." That's a mechanical, repeatable job, which is exactly the kind of job worth automating instead of doing by hand once a year when the invoice finally gets someone's attention.
DDCostControl runs this checklist against your own Datadog org, self-hosted, with your API keys staying in your own .env — never in a database we operate. If your bill is in that $15K–40K/year range and doesn't quite add up, we'd rather talk to you directly than have you find out the hard way.