When the monthly total drops but the daily spike is real
In a recent beta run against a workforce-scheduling SaaS company's Datadog org, the report surfaced something that reads as a contradiction until you look closely: the ingested_spans product family's monthly cost fell 44% from March ($21.59) to April ($12.09) — a clean, apparently-good-news decrease. And yet, inside that same April, daily ingestion throughput (ingested_events_bytes) jumped 234.4% on a single day, April 9th, from roughly 8.93 billion bytes/day to roughly 29.86 billion bytes/day. One number went down. The other went up, sharply, on one exact date, inside the period where the first number was falling.
Both facts are true at the same time. Neither is a data error. Understanding why is a short lesson in exactly why day-by-day usage analysis exists as a separate step from month-over-month cost comparison — they are not the same question, and trusting only the monthly total would have buried this finding completely.
A monthly total is a single number standing in for thirty different days
Comparing estimated_cost month over month tells you whether the bottom line moved. It does not tell you whether every day in that month behaved the same way, and it does not tell you whether the dollar figure and the underlying raw usage moved in the same direction — because dollars and bytes aren't the same measurement, and the relationship between them can shift for reasons that have nothing to do with whether your engineers shipped more or less instrumentation. A monthly cost figure blends 30 days of billing into one number; if usage is low for three weeks and enormous for one week, the monthly total shows you an average, not the shape.
We're being precise here rather than confident: we don't know, from this report alone, the exact mechanism that let a falling monthly cost coexist with a 234% single-day throughput spike in the same product family. It could be a billing-tier effect, a change in which sub-metric within ingested_spans was driving cost that month, or something else in how the two figures are computed. What we do know is that both numbers are real, they come from different API calls (estimated_cost for the monthly figure, day-by-day hourly_usage for the throughput figure), and only one of them would have shown you April 9th at all.
Why the tool still flags this instead of calling it a false alarm
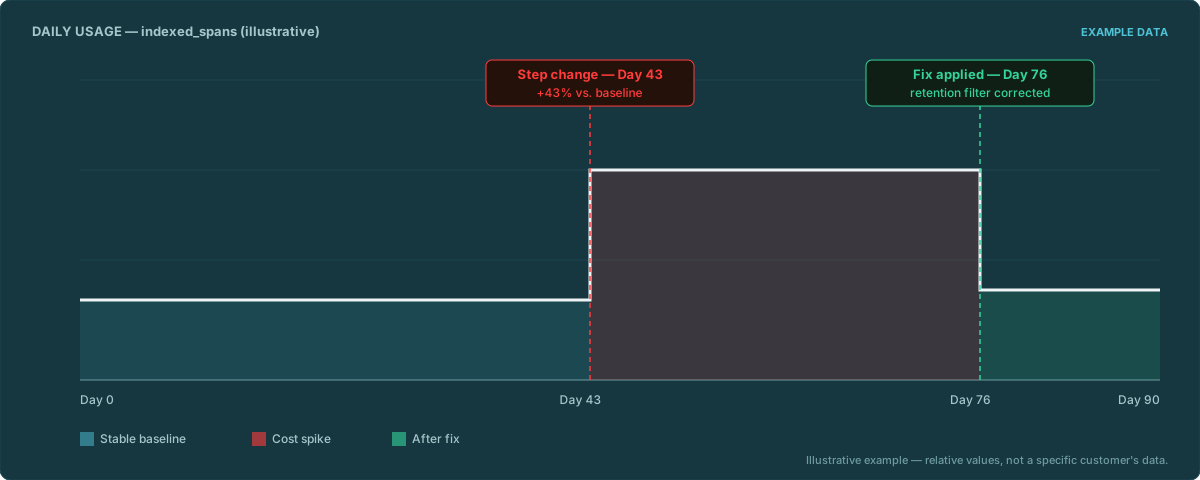
A 234% jump in raw ingestion on one specific day is worth investigating regardless of what the monthly invoice did, for the same reason covered in our case study on tracing a spike to an exact commit: a long stable baseline followed by a step-change on one day is the signature of something that shipped, not something that grew organically. Whether or not this particular step-change is currently costing more money, it's a change in behavior that started on a knowable date — and "check recent deployments around April 9th for extra instrumentation" is a five-minute git-log lookup once you have that date, exactly as it was in the case study.
The general lesson: don't let a good-looking monthly total close the investigation
It's tempting to read "cost for this product family went down" as "no action needed here." This finding is a direct counterexample. If a step-change of this size can sit inside a month where the total cost fell, it can just as easily sit inside a month where the total cost looks flat, or only modestly up — quietly compounding until it eventually does show up as an obvious monthly jump, at which point you've lost the ability to point to a single exact day and are back to guessing across a whole quarter. The same day-by-day method covered in the retention-filters post and the case study applies here: pull hourly_usage day by day, look for the stable-baseline-then-step pattern, and don't let a well-behaved monthly rollup convince you there's nothing underneath it.
DDCostControl runs day-by-day turnover-date detection on every product family automatically, independent of whether the monthly total looks fine — because a good monthly number doesn't mean every day inside it was.
Email us — arena@wagoe.com